

Show how RAMS works.
Help reveal where RAMS influences design, how teams collaborate, and which constraints shape delivery.
RAMS Industry Study Research by PHM Technology
Take the 2027 survey (opens in a new tab)What is changing in RAMS, and what is still holding it back? Share your experience of the tools, decisions and pressures shaping your work.
Take the 2027 survey (opens in a new tab)Share your perspective · Survey opens in a new tab
Every stage of practice matters.
Using AI, evaluating it, or not using it at all? Your experience belongs in the study.
The 2027 study builds on earlier measures of RAMS practice, with a deeper focus on AI use, value and engineering verification.
Help reveal where RAMS influences design, how teams collaborate, and which constraints shape delivery.
Contribute your experience of adoption, checking outputs and the value that remains after review and rework.
Show where better tools, skills, data and organisational support could make a difference.
Contribute to the 2027 RAMS Industry Study.
Latest available report
The 2026 report brings together respondent findings and the 2024–2026 longitudinal analysis. The 2027 results are not yet published.
109 completed responses. A snapshot of the tools, priorities and organisational practices reported in the 2026 study.
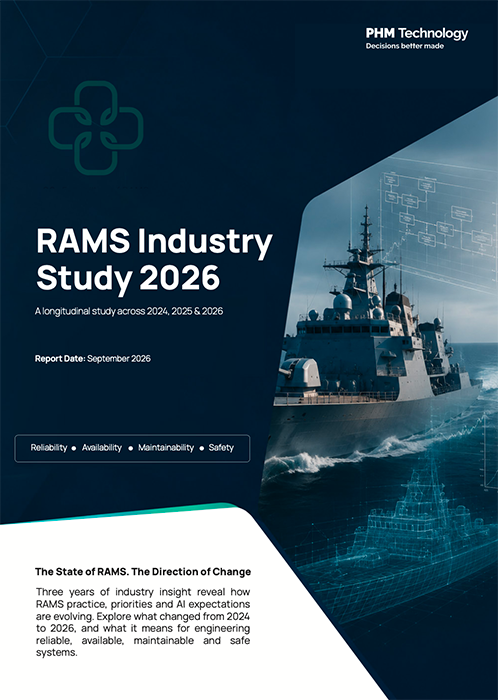 Download 2026 report
2026 findings · 2024–2026 trends · PDF
Download 2026 report
2026 findings · 2024–2026 trends · PDF
Perceive RAMS as mainly a compliance activity.
2026 respondents · n=109 · Report pp. 11, 28–29Use Microsoft Excel for RAMS work.
2026 respondents · n=109 · Report pp. 12, 33Report a documented RAMS strategy.
2026 respondents · n=109 · Report pp. 13, 33Respondents expect RAMS to improve asset performance and enter design earlier. These are expectations, not measured outcomes.
A strong case for earlier engineering influence
Share selecting each future expectation · 0–100% scale
Report pp. 15, 29. Multi-select, n=109.
More than half connect digitisation with systems engineering or organisational digital transformation.
Integration is part of the intended direction
Share selecting each digital association · 0–100% scale
Report p. 14, Figure 5. Multi-select, n=109.
A documented plan is common. The separate objectives question has a smaller response base and should not be read as a direct comparison.
Measure how RAMS changes decisions
Share answering yes or selecting the stated option · 0–100%
Report p. 13, Figure 4. Different item bases shown explicitly. No subtraction between these percentages.
Half of coded comments about the five-year RAMS role mention AI or automation. This is a qualitative signal—not a rate of AI use.
From future interest to questions of assurance
Share of coded five-year role comments · 0–100% scale
Report pp. 18, 31. Keyword-assisted, non-exclusive coding. 2026 five-year role comments n=91.
These findings describe participating respondents, not the entire industry. Annual samples are independent. Multi-select percentages can total more than 100%. Changes are exploratory signals, not evidence that the same organisations changed over time.
Source: PHM Technology, RAMS Industry Study 2026, September 2026. Question bases and report page references are shown with each chart. Earlier-year bases are not stated in the cited longitudinal passages.
Percentage point changes subtract the earlier percentage from the later percentage. No claim of causation, population representativeness or statistical significance is made here.
Includes the respondent profile, industry comparisons, three-year analysis and methodological limits.
Compare the same measures across annual samples. This view focuses on direction and change, rather than repeating the latest year dashboard.
Download report + trends
2026 findings · 2024–2026 trends · PDF
Between 2024 and 2026, compliance led perceptions rose while recognition as a critical design component fell.
Design component: −21.0 percentage points
Share of respondents selecting each perception · 0–100% scale
Report pp. 28–29. Multi-select. 2026 n=109; 2024 base not stated in the cited passage.
Selection of the impact of AI as an operational challenge rose in 2026. This measures perceived challenge, not AI adoption.
2024 to 2026: +11.4 percentage points
Share selecting “impact of AI” as a challenge · 0–100% scale
Report p. 31. Multi-select. 2026 n=109; earlier bases not stated in the cited passage.
Its share declined gradually, but spreadsheets remained central to RAMS work in each annual sample.
2024 to 2026: −7.0 percentage points
Share selecting Microsoft Excel · 0–100% scale
Report p. 33. Multi-select. 2026 n=109; earlier bases not stated in the cited passage.
Documented RAMS strategy stayed close to half of respondents across the three annual samples.
2024 to 2026: +1.4 percentage points
Share reporting a documented strategy · 0–100% scale
Report pp. 13, 33. Single-select. 2026 n=109; earlier bases not stated in the cited passage.
These findings describe participating respondents, not the entire industry. Annual samples are independent. Multi-select percentages can total more than 100%. Changes are exploratory signals, not evidence that the same organisations changed over time.
Source: PHM Technology, RAMS Industry Study 2026, September 2026. Question bases and report page references are shown with each chart. Earlier-year bases are not stated in the cited longitudinal passages.
Percentage point changes subtract the earlier percentage from the later percentage. No claim of causation, population representativeness or statistical significance is made here.
Share your experience in the 2027 study.
Revisit the earlier findings on RAMS influence, team challenges and improvement priorities.
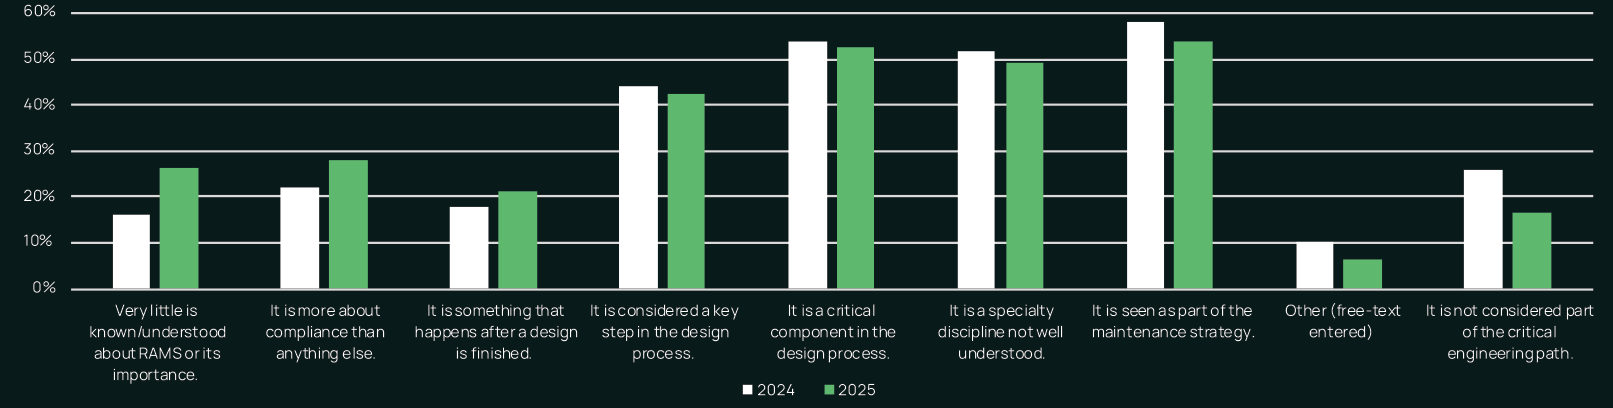
Download 2024–2025 reportThe report describes fewer respondents seeing RAMS as outside the critical engineering path in 2025. At the same time, poor understanding and compliance-led perceptions became more common. These are different aspects of how RAMS is viewed; recognition alone does not demonstrate effective integration.
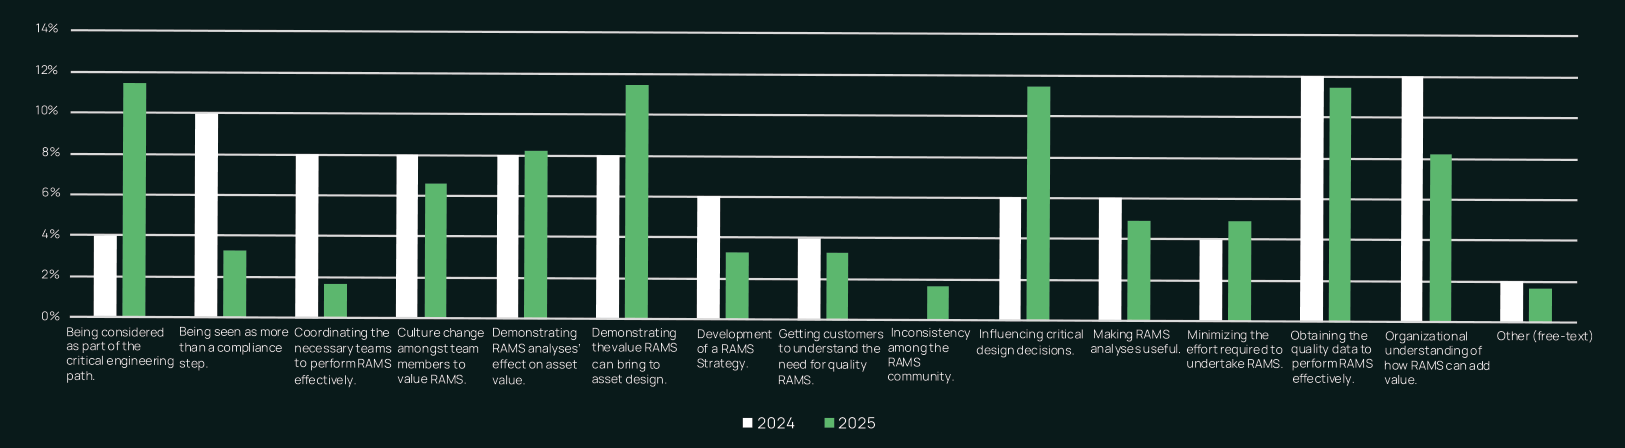
Data quality and demonstrating RAMS value remained prominent concerns. In 2025, greater emphasis was placed on securing a role in the critical engineering path and influencing design decisions. The report frames the challenge as connecting analyses to the decisions they should inform.
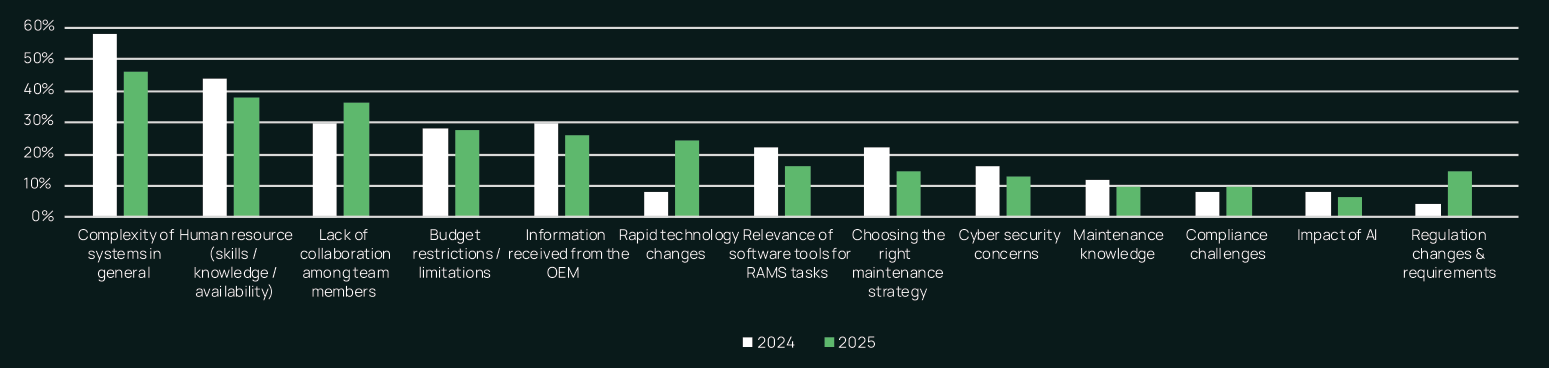
System complexity, skills and resource availability, system understanding, and cross-team collaboration remained recurring challenges. Rapid technology change became more prominent in 2025, adding pressure to teams already managing complex systems.
Respondents identified systems engineering and MBSE integration, better data, and skilled RAMS engineers as important ways to improve outcomes. The report highlights increased emphasis in 2025 on involving RAMS earlier in design. These are respondents’ priorities, not measured effects of an intervention.

Across both years, early involvement in engineering design and improved asset performance stood out as expectations for RAMS. These responses describe what participants expected RAMS to contribute, rather than evidence that those outcomes had already been achieved.
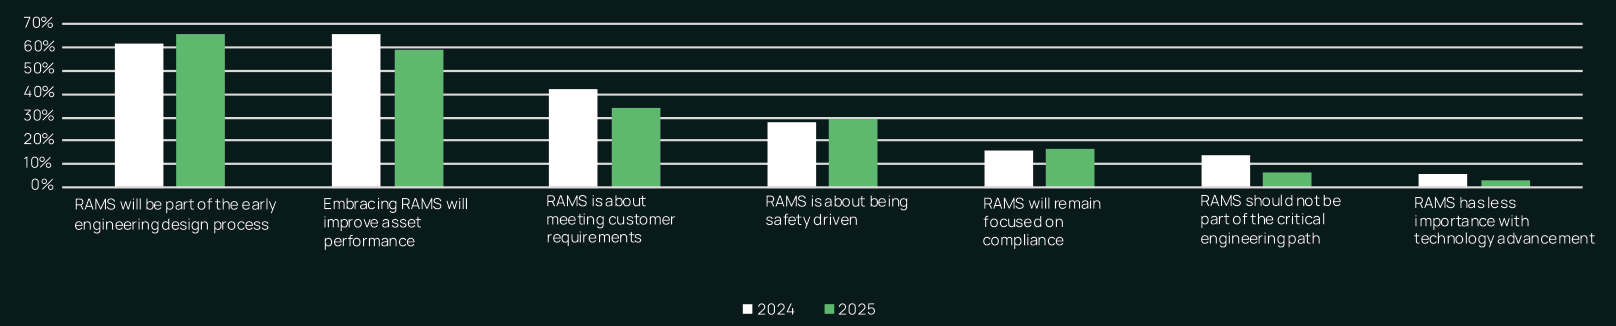
The report describes a multi-sector survey repeated with the same questions in 2024 and 2025. It includes multi-select and perception based questions. Responses may therefore sum to more than 100%.
Charts are reproduced directly from the original report. Their scales differ, so compare the axis labels as well as the bars. Exact percentages have not been estimated from bar heights. The report does not supply a respondent denominator for each chart or establish that the same people answered in both years; the findings should not be treated as population estimates or within-person change.
Source: PHM Technology, The State of RAMS Engineering: Industry Trends 2024–2025 , version 1.4, pp. 1–4. The report’s model-based recommendations are interpretations of these survey findings.
Read the original comparative report, including all five question areas, charts and the authors’ conclusions.
PDF · Four pages · Version 1.4